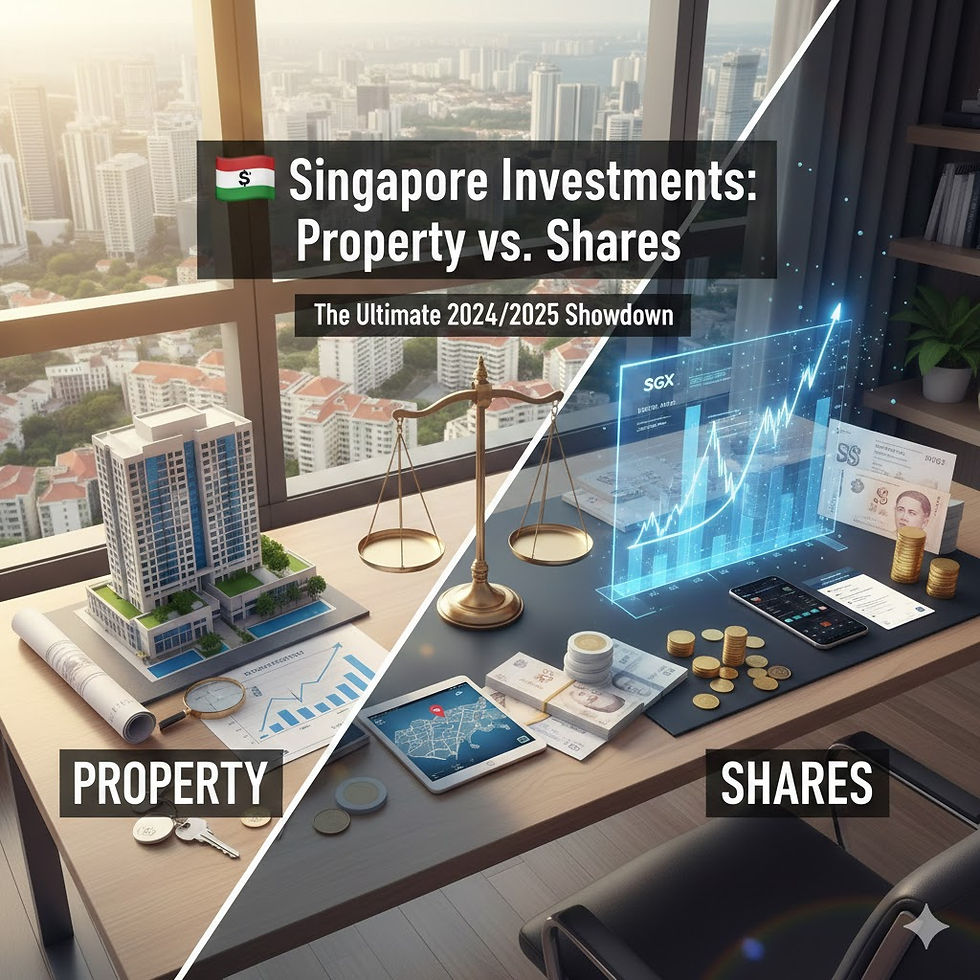
🇸🇬 Singapore Investments: Property vs. Shares - The Ultimate 2024/2025 Showdown
- - -
- Dec 3, 2025
- 7 min read
Property vs. Shares: Singapore Investment
🇸🇬 Singapore Investments: Property vs. Shares - The Ultimate 2024/2025 Showdown
Singapore is a city of wealth builders. For decades, the primary debate among investors has centered on two powerhouses: direct real estate ownership and investing in the stock market (equities). Both asset classes offer proven pathways to financial freedom in the Lion City, but their characteristics, risks, and potential returns are fundamentally different.
In the current environment of high interest rates, stringent cooling measures, and shifting global economic tides, which investment reigns supreme for the average Singaporean investor?
This comprehensive guide breaks down the core differences, long-term performance, and strategic considerations for choosing between Property and Shares in the 2024/2025 landscape.
Head-to-Head Comparison: Property vs. Shares
Feature | Direct Property Investment (e.g., Condo) | Shares/Equities (e.g., STI ETF, Global Stocks) |
Barrier to Entry | Very High. Requires substantial upfront capital (25% downpayment + Stamp Duties). | Very Low. Start with a few hundred dollars. |
Liquidity | Low. Selling takes months (valuation, negotiations, legal process). Subject to Seller's Stamp Duty (SSD) within 3 years. | High. Can be bought or sold instantly during market hours. |
Volatility/Risk | Lower/Slower. Prices fluctuate over longer periods. Government policies promote stability. | Higher/Faster. Daily price swings; impacted by company performance, global news, and economic shifts. |
Leverage Potential | High. Banks offer mortgages (OCBC, DBS, UOB, etc.) allowing you to control a large asset with a small deposit, amplifying returns (and losses). | Low. Limited to riskier margin trading. Generally bought with own capital. |
Diversification | Low. Typically concentrated in a single, multi-million dollar asset in one location. | High. Easily diversify across sectors, countries (e.g., S&P 500), and hundreds of companies with minimal capital. |
Passive Income | Rental Yield (often 2–4% in Singapore) + Capital Appreciation. | Dividends (can be reinvested) + Capital Appreciation. |
Hedge Against Inflation | Strong. Real assets and rents tend to rise with inflation over the long term. | Good. Strong companies can pass on higher costs, but not all stocks perform well in high-inflation environments. |
Long-Term Performance: The Returns Reality
While cultural preference in Singapore heavily favors real estate (with over 64% of Singaporeans ranking it as their preferred asset), historical data suggests a different story for long-term average returns.
Singapore Private Residential Property: Historically, private residential property in Singapore has returned an average of 3-5% per year (capital appreciation only), with total returns (including rental yield) often reaching 5-7% per year over the last two decades. The key is its stability.
Global/Developed Market Equities: Global stock indices like the MSCI World Index or the S&P 500 have historically returned an annual average of 8-10% over the very long term. The Straits Times Index (STI) has delivered a slightly more modest, but still robust, annualized return of around 7% over the past decade.3
Verdict: Over the long term (20+ years), globally diversified equities have typically delivered a higher average rate of return than direct Singapore residential property. However, property's strength lies in its stability and the powerful effect of leverage.
Property Investment in 2024/2025: Key Considerations
The Singapore property market remains resilient, but the landscape is shifting from rapid price surges to a more stable, moderate growth environment (forecasted 3-6% price increase for private residential in 2025).
The Power of Leverage & Stability
The biggest advantage of property is the ability to use a bank mortgage (leverage). With a 75% loan, a 10% appreciation in the property's value can translate to a roughly 40% return on your initial cash outlay (excluding interest and costs). This amplified return is difficult to replicate in other asset classes.
The Challenge: High Costs and Cooling Measures
High Interest Rates: Elevated mortgage rates significantly increase monthly servicing costs, dampening affordability and investment sentiment.
Additional Buyer’s Stamp Duty (ABSD): The high ABSD, especially for foreigners (60%) and second/subsequent properties for Singapore Citizens (20% to 30%), has largely contained speculative demand. This makes acquiring a second investment property highly expensive.
Low Rental Yields: With prices soaring faster than rents, rental yields are often compressed, making cash flow tight for investors.
Strategic Tip: Investors seeking real estate exposure without the high capital and low liquidity of direct ownership should consider Singapore Real Estate Investment Trusts (S-REITs). These are highly liquid, offer attractive, often tax-exempt dividend yields (historically 5-7%), and require a very low starting capital.
Shares Investment in 2024/2025: Key Considerations
Equities offer the modern investor a powerful combination of accessibility, liquidity, and superior historical returns for long-term wealth building.
Accessibility and Diversification
You can start investing with as little as a few hundred dollars via platforms that offer fractional shares or low-cost Exchange Traded Funds (ETFs) that track global indices. This allows young investors to begin compounding their wealth years, or even decades, before they can afford a downpayment on a property.
The Volatility Test
The stock market is highly volatile. A global crisis or economic downturn can cause a swift 20-30% drop in your portfolio value. Successful equity investing requires emotional discipline to stay invested during downturns and maintain a long-term horizon.
Beyond Singapore
A Singaporean investor can easily buy shares in the US, Europe, or China, diversifying away from Singapore’s relatively small local market. A common and effective strategy is dollar-cost averaging into a globally diversified, low-cost ETF over a long period.
The Right Strategy for You
The question isn't whether Property or Shares is better, but which one is better for your current financial stage and goals.
1. The Young Professional / First-Time Investor
Focus: Shares. Prioritize high-growth potential, liquidity, and low barrier to entry. Build up a diversified portfolio via low-cost ETFs and individual stocks.
Goal: Maximize long-term compounding and accumulate the capital required for a future property downpayment.
2. The Mid-Career Investor / Homeowner
Focus: Both (The "Core-Satellite" Approach).
Property (Core): If your primary home is paid off or well-mortgaged, it serves as a stable, leveraged core asset. Consider upgrading or using it for rental income later.
Shares (Satellite): Use monthly savings to invest consistently into a diversified equity portfolio to maintain long-term, high-return growth potential.
S-REITs: Consider S-REITs for income diversification and hassle-free exposure to the real estate sector.
3. The Retirement/Income-Focused Investor
Focus: Income-Generating Assets.
Property: Use rental income to supplement retirement funds.
Shares: Focus on high-dividend-yielding stocks (Singapore blue chips) and high-yield S-REITs for consistent passive income.
Final Takeaway
The Singapore investment debate is a false dichotomy. Property is a powerful, leveraged tool for forced savings and stability, while shares are the engine for maximizing long-term capital growth and diversification.
For most Singaporeans, a truly resilient and optimal investment portfolio should incorporate both asset classes—using your primary property as a stable, foundational asset and your equity investments as the liquid, growth-focused component.
Side-by-side Comparison of the Projected Costs and Returns for a Sample S$1 million Investment in a Condo vs. a Stock Portfolio
That is an excellent way to ground the discussion in reality. The comparison highlights a crucial difference: Leverage and Liquidity.
Here is a side-by-side projection of a S$1 Million Cash Investment over a 10-year period, based on prevailing Singapore norms and historical average returns.
10-Year Projection: S$1 Million Investment
We will model two scenarios for the property investment, showcasing the impact of leverage, a key factor often overlooked.
Assumptions:
Metric | Investment Property (Scenario 1: High Leverage) | Investment Property (Scenario 2: Low Leverage) | Stock Portfolio (Global ETF) |
|---|---|---|---|
Initial Capital | S$1,000,000 (The total amount you have to deploy) | S$1,000,000 (The total amount you have to deploy) | S$1,000,000 |
Asset Price | S$1,500,000 Condo | S$1,100,000 Condo | N/A |
Loan-to-Value (LTV) | 75% LTV (Assumes first property / no existing loan) | 55% LTV (Assumes second property / existing loan) | N/A |
Initial Cash Outlay | ~S$480,000 (Rest of S$1M is used as a cash buffer) | ~S$640,000 (Rest of S$1M is used as a cash buffer) | S$1,000,000 |
Annual Growth Rate (Capital) | 3% p.a. (Conservative SG average) | 3% p.a. | 8% p.a. (Historical global average) |
Annual Income Rate | 3.5% Gross Rental Yield | 3.5% Gross Rental Yield | 2.0% Dividend Yield |
Income Strategy | Reinvested into cash/used to offset expenses | Reinvested into cash/used to offset expenses | Reinvested (Compounded) |
Time Horizon | 10 Years | 10 Years | 10 Years |
Initial Costs and Required Capital
This table illustrates why real estate has a much higher barrier to entry, even with the same starting capital.
Expense / Item | Condo (S$1.5M, 75% LTV) | Condo (S$1.1M, 55% LTV) | Stock Portfolio (S$1M) |
Purchase Price (A) | S$1,500,000 | S$1,100,000 | S$1,000,000 |
Loan Amount | S$1,125,000 (75%) | S$605,000 (55%) | S$0 |
Cash / CPF Down Payment (25% or 45%) | S$375,000 (25%) | S$495,000 (45%) | N/A |
Buyer's Stamp Duty (BSD) | S$44,600 | S$28,600 | S$0 |
ABSD (Assumed 0% for first property, 20% for second property) | S$0 (Assumed First Property) | S$220,000 (Assumed Second Property) | S$0 |
Legal/Valuation Fees (Est.) | S$3,500 | S$3,500 | ~$100 (Brokerage fees) |
Total Upfront Outlay | S$423,100 | S$747,100 | ~$1,000 |
Initial Investment Capital Used | S$423,100 | S$747,100 | S$1,000,000 |
Remaining Cash Buffer from S$1M | S$576,900 | S$252,900 | S$0 |
Projected Annual Cash Flow & Holding Costs (Year 1)
This highlights the critical difference: Stocks are cash-flow positive; leveraged property is often cash-flow negative.
Expense / Item | Condo (S$1.5M, 75% LTV) | Condo (S$1.1M, 55% LTV) | Stock Portfolio (S$1M) |
Gross Annual Rent (3.5% yield) | S$52,500 | S$38,500 | N/A |
Annual Operating Costs (1% of value: Tax, Maintenance, Agent, Vacancy) | (S$15,000) | (S$11,000) | (S$1,000) (Platform/ETF fees) |
Net Rental Income | S$37,500 | S$27,500 | N/A |
Annual Mortgage Interest (Assumed 3.8%) | (S$42,750) | (S$23,000) | N/A |
Net Cash Flow (before principal repayment) | (S$5,250) (Negative) | S$4,500 (Positive) | S$20,000 (2.0% Dividend) |
Projected Final Value (After 10 Years)
This table shows the dramatic impact of the different growth rates and the power of leverage on the final return on equity.
Metric | Condo (S$1.5M, 75% LTV) | Condo (S$1.1M, 55% LTV) | Stock Portfolio (S$1M) |
Final Property/Portfolio Value | S$2,015,875 (+3% p.a. capital gain) | S$1,478,574 (+3% p.a. capital gain) | S$2,158,925 (+10% p.a. total return) |
Net Cash Flow over 10 Years | (S$52,500) (Approx. total cash needed) | S$45,000 (Approx. total cash generated) | S$0 (Dividends reinvested) |
Total Principal Repaid (Equity Built) | S$324,500 (Approx.) | S$176,500 (Approx.) | N/A |
Outstanding Mortgage (Year 10) | S$800,500 | S$428,500 | N/A |
Final Net Equity (Value - Loan) | S$1,215,375 | S$1,049,074 | S$2,158,925 |
Total Profit (Final Equity - Initial Capital Used) | S$792,275 | S$301,974 | S$1,158,925 |
Conclusion from the Comparison:
Stock Portfolio (Global ETF): Achieves the highest total value (S$2.16M) and profit over 10 years due to the superior long-term compounding rate (8% capital + 2% reinvested dividend). It is 100% liquid and cash-flow positive from day one.
Highly Leveraged Condo (S$1.5M): Achieves a high total return on equity due to the immense power of leverage. Despite a lower 3% capital growth, the leveraged structure turns a S$423k cash outlay into S$1.2M equity, a roughly 187% total return on the initial cash. However, it is cash-flow negative and carries significant interest rate risk.
Low Leveraged/Second Condo (S$1.1M): Due to the high ABSD and lower leverage, the compounded return is significantly less compelling than the highly leveraged property or the stock portfolio.
Key Takeaways for the Singapore Investor
Investment | Best for... | Major Risk |
Highly Leveraged Property | Maximum wealth acceleration over a short period (10-15 years) in a rising market. | Interest Rate Risk (High mortgage payment) and Illiquidity (Cannot sell easily). |
Stocks/ETFs | Long-term, globally diversified, hands-off compounding (20+ years). | Market Volatility (Seeing your portfolio drop 30% during a crisis). |
🇸🇬 Singapore Investments: Property vs. Shares - The Ultimate 2024/2025 Showdown


Comments